


As example https://graph.tchekov.net/app/FX=SIN(DIV(X,CST(2)))
Starts the application with F(x) = sin(x/2)
https://graph.tchekov.net/app/FX=SIN(DIV(X,CST(2)));GX=COS(X) etc.
| Symbol | Function |
|---|---|
|
Opens the main 'menu' |
|
Create screenshot |
|
Open the function settings. Scroll up/down to find the needed setting and tap on it. According to the selection, appropriate change methode will be offered. Also opens the settings for 'Work with - Build from'. |
|
Here you switch visibility of view elements such as derivatives, grid, calculation result etc. To toggle visibility just tap on item. |
|
Set the root finding method used with the touch-and-move margin functionality. |
|
Creates and shows different reports (such as: full function value table, application log, report) in html format. If the storage permission is granted the report will be also saved. Report creation takes some time, if needed respective progress bar will be shown for this period. |
|
Opens the color settings pane. |
|
Opens the dimension settings pane. |
|
Show current calculation results. Here you can copy calculation result for further usage. It is also possible here to create detailed report for the calculations. |
LICENSE:
aGraph is Freeware.
aGraph is called in the following software.
LIMITED WARRANTY:
THIS SOFTWARE IS PROVIDED 'AS-IS' AND WITHOUT WARRANTY OF ANY KIND,
EXPRESS, IMPLIED OR OTHERWISE, INCLUDING WITHOUT LIMITATION, ANY
WARRANTY OF MERCHANTABILITY OR FITNESS FOR A PARTICULAR PURPOSE.
IN NO EVENT SHALL THE AUTHOR BE LIABLE FOR ANY SPECIAL, INCIDENTAL,
INDIRECT OR CONSEQUENTIAL DAMAGES OF ANY KIND, OR ANY DAMAGES
WHATSOEVER RESULTING FROM LOSS OF USE, DATA OR PROFITS, WHETHER OR NOT
ADVISED OF THE POSSIBILITY OF DAMAGE, AND ON ANY THEORY OF LIABILITY,
ARISING OUT OF OR IN CONNECTION WITH THE USE OR PERFORMANCE OF THIS
SOFTWARE, EXCEPT TO THE EXTENT OF ANY UNAVOIDABLE STATUTARY LIABILITY.
USE AND DISTRIBUTION OF THIS SOFTWARE IS FREE:
YOU ARE HEREBY LICENSED TO MAKE AS MANY COPIES OF THIS SOFTWARE AS YOU
WISH; GIVE EXACT COPIES OF THE ORIGINAL VERSION TO ANYONE; AND
DISTRIBUTE IN ITS UNMODIFIED FORM VIA ELECTRONIC MEANS. THERE IS NO
CHARGE FOR ANY OF THE ABOVE. YOU ARE
AUTHORIZED TO FREELY USE THIS SOFTWARE.
PGraph uses two approximation methods which I will try to describe. For deep-going information, please look into all good mathematics books.
This text serves only as extension for the PGraph operating instructions, other purposes arenot intended.
The so called "Wrong rule" (or Secant Method) is a procedure for determination of intersections (method for solving equations of finding roots).
We look for the x - value, that makes F(x) to 0 (intersection of F(x) and the x - Axis).
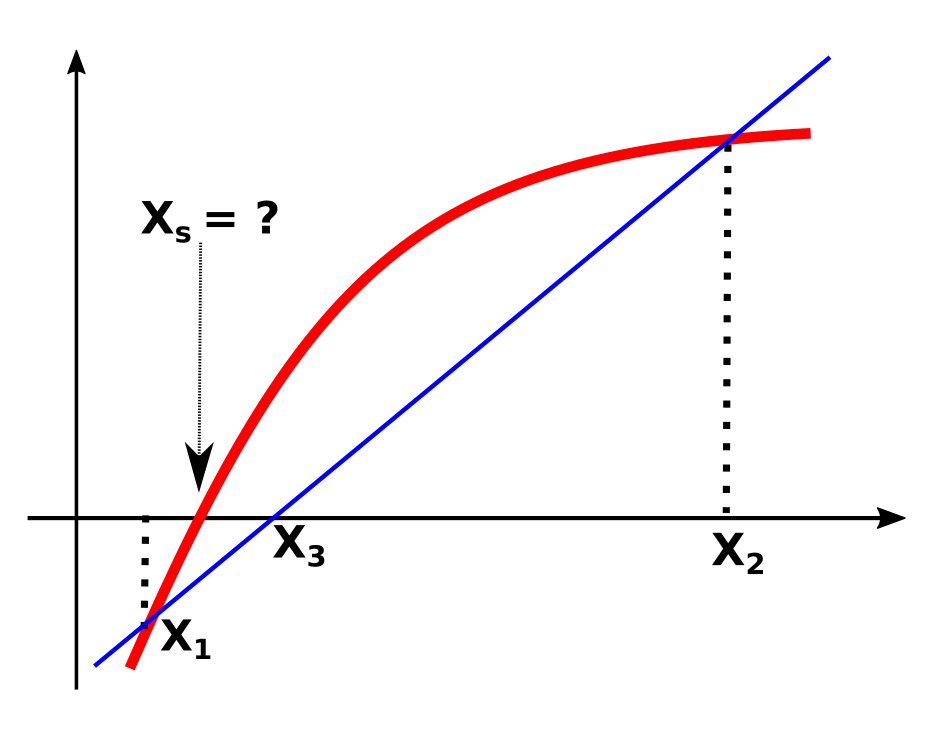
F(x) is replaced by the secant, so the formula:
supplies us an approximate value (the intersection of the secant with the x axis).
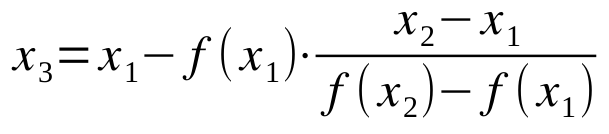
If we repeat this procedures often enough with values X1 and X3 or X2 and X3 (aGraph makes this 100 times, or until F(X1)=F(X2)) - we will become an value that is very close to the real one. The approximation is sufficient for ordinary purposes, mathematical is it however NOT correct. These procedure functions only if some basic conditions are given - for further information please look into the appropriate books.
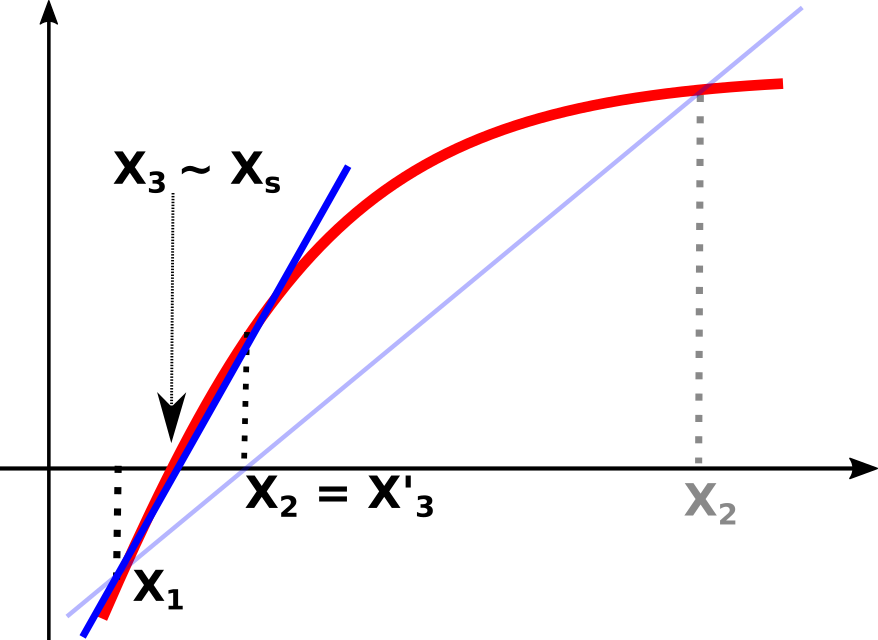
The procedures for numeric determination of surface under function (integration) are based on the same basic principle: The surface must be divided into many strips, finding the surface or every single strip, and then sum of all strips.
The Simpson procedure uses parabola as upper delimitation of the stripes (other procedures use straight lines).
This supplies better approximate values. To define a parabola we needs at least 3 points, also Simpson Method uses double strips.
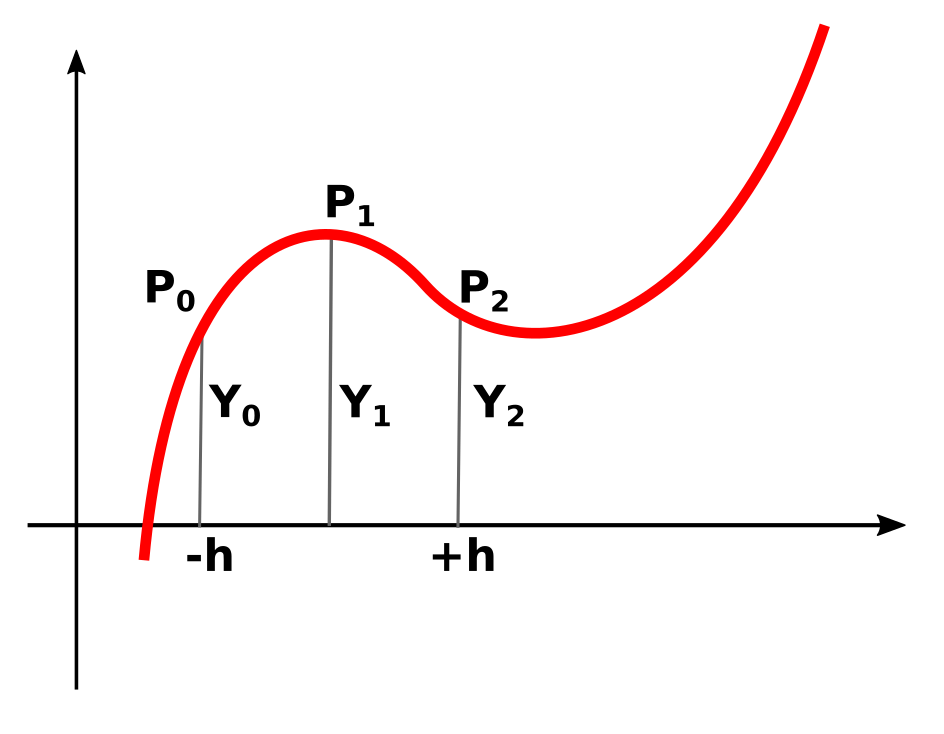
First the surface is divided at even number of stripes (PGraph - uses 100), then find the strip width h.
Double stripes P0, P1, P2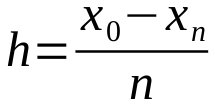
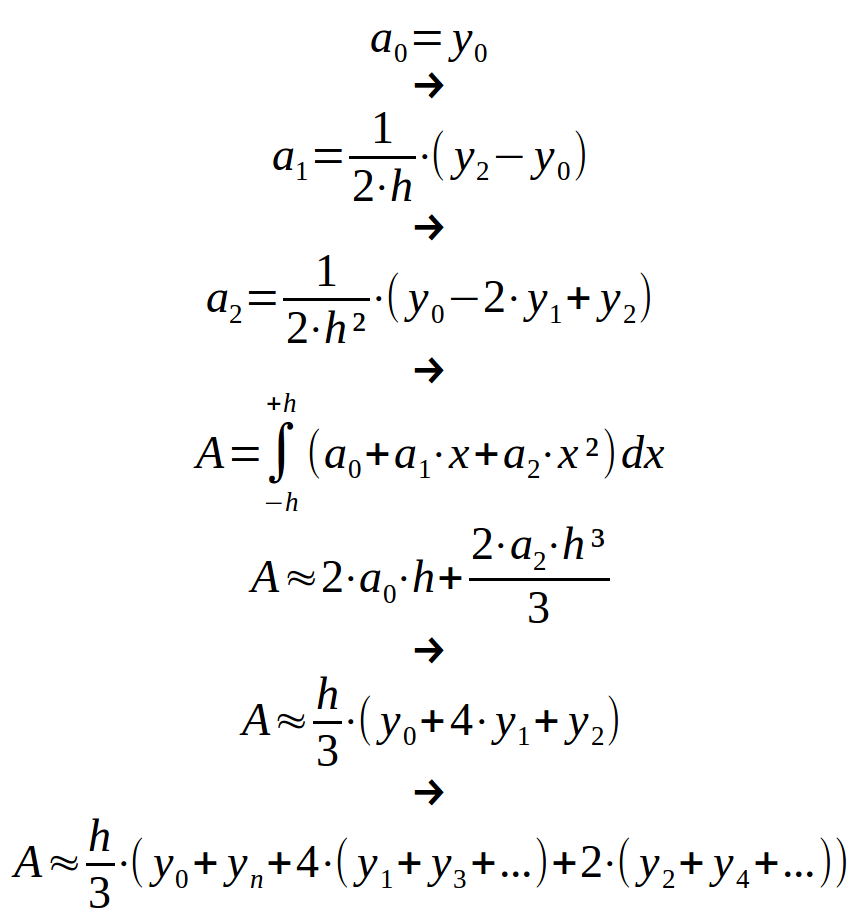
Afterwards the three sums are created (Summ1 = first + last strips, Summ2 = sum of the odd strips, Summ3 = sum of the even strips).
Then the last formula is used and we receives a numeric approximate value for the surface under the function.
All further abilities of aGraph, which are based on integration, develop on the Simpson procedure.
aGraph does not collect any data. Nothing is collected, transfered, saved or analysed.
aGraph will ask only for "Write external storage" permission which is neede is you wish to save your reports
The application will work just fine withot this permission, only the reports you create will be temporary and will not be saved.